Archive for the ‘Exposure, Histogram, ISO, White Balance, Color Temperature’ Category

The Histogram

Mid Range of Tones

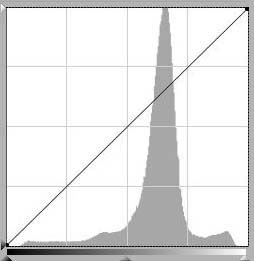
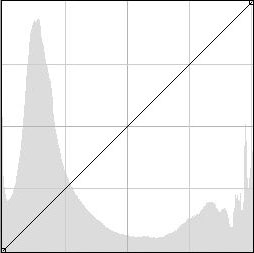
The histogram on your camera is the most important camera control or tool to ensure that you capture a full range of tones in the image. When you look at the histogram it essentially represents the number of stops of exposure which the camera is capturing.

The far left side of the histogram represents full black and the far right side indicates full white. The difference from left to right indicates the dynamic range of the camera, depending on the camera the difference may be 5 EV (5 stops) or 6, 7 or 8 EV depending on the capability of the camera in capturing the full range of tones. The correct exposure is when all of  the histogram graph is contained within the far left and far right limits of the histogram.

The histogram at the left indicates that the full range of  tones has been captured with the majority of the tones in the middle. It does not matter how high it is as long as it is not touching the left side or the right side and also that none of the tones have extended beyond those limits and have been cut off.

If the graph is touching the left side it shows that areas in the image are conpletely black and and you will not be able to fix these areas of the image in post processing, thus some of the dark tone detail will be lost.

Dark Tones

If the graph is touching the right side of the histogram it shows that areas in the image are conpletely white, blown out and and you will not be able to fix these areas of the image in post processing, thus some of the blown out detail will be lost.

If pixels are completely black or completely wthite the piuxels can be lightened or darkened, but the detail represented can never be recovered.

The histogram on the left is the histogram representing a dark night scene where most of the content of the histogram is close to the lleft side representing black, but note the none of the black detail has  been lost or cut off on the left side. To see the actual image of this histogram click here.

In the Dark tone histogram above it can be seen that most of the tonal values are on the left side of the histogram, however this is to be expected as the image was a dark night scene with only a small amount of city lights in the background. In this image some of the tones on the left may have been cut off and consequently there may be a small amount of blown highlights in the city lights.

Light Tones

In the last histogram it represenst a scene with quite a lot of light tones in the image, however from the histogram we see that there are no tones cut off on the left side and although there nis a lot of tonal content close to the right side there are no tones cut off.

A good exposure needs a large range od tonal values, fully spread acrass the histogram with none of the tones touching either side of the histogram.

The  general theory behind a perfect digital file is to expose to the right of the histogram, but to ensiure that no tones are cut off at the right side. Even if your end result is a dark looking image it may be better to expose to the right and then darken the image later in post processing.

Auto ISO

Auto ISO is a setting now provided in most cameras and it can prove to be very useful.

When we used film we were commited to the ISO setting of the film until the film was finished and then we would place a higher ISO film in the camera and commence shooting again.

With the introduction of digital imaging we can now change the ISO at any time we desire. Most cameras now also have an auto ISO setting.

In general people tend to avoid the Auto ISO feature on the latest cameras in fear that the camera will automatically increase the ISO up and introduce noise into the image. It is a known fact that higher ISO settings do introduce more noise. While this is very much a concern, the Auto ISO feature is very useful and generally applies conservative settings.

Also the Auto ISO setting has various options to limit the range of settings to ensure the quality of images is preserved.

With Auto ISO the camera attempts to use the lowest level of ISO setting and the camera will automatically adjust the ISO, as the shutter speed is reduced the ISO will increase, also the lens focal length will have a bearing on the change in ISO.

Essentially as the amount of light diminishes the camera ISO will increase. This is a very powerful tool to use in action shooting, where the camera will automatically compensate as the available amount of available light reduces.

Dynamic Range

The Dynamic range of a camera can be defined as the ratio between the maximum and minimum light intensities from the sensor. The maximum ligjht intensity representing white and the minimum light intensity representing black. The dynamic range can be measured in f-stops to describe the overall light range available, summing up it is the amount of detail recorded between the highlights and shadows in the image.

Fill in electronic flash may be used to bring out detail in the shadows of the image to reduce the dynamic to be captured by the camera.

Post Processing

In Photoshop or with the camera settings, we can enhance the dynamic range by decreasing the contrast. In adddition, Photoshop has shadow/highlight slider adjustments to help bring out detail in the shadows and also to bring out detail in the highlights.

Viewing the histogram of the image can indicate whether the full dynamic range of the image has been captured.

Full Dynamic Range

This first histogram above indicates that all tones within the image are captured within the histogram, being just captured on the left hand side and with some margin on the right hand side.

Partial Dynamic Range

The second histogram above indicates that some of the highlights have been cut off on the right hand side and some of the shadows have been cut off on the left hand side, thus the camera has not captured the full dynamic range of the scene.

To overcome the dynamic range limitations the photographer may need to adjust the exposure of the camera to capture the tones to best suit the circumstances.

An alternative is to capture the full range of tones in the image by bracketing exposures and combining the exposures in software to form a HDR (high dynamic range) image.

Exposure Value

Most modern cameras and light meters measure the photons of light reflected from the subject in terms of Exposure Value (EV). The greater the number of photons received, the greater the electricity that is produced by the light meter. International standards specify how much light received equals a certain EV number. This value is measured by the following number series (for ISO 100 film or digital sensor):

-2, -1 0, 1, 2, 3, 4, 5, 6, 7, 8, 9, 10, 11, 12, 13, 14, 15, 16, 17, 18, 19, 20, 21, 22, 23,

In the above table even though it appears to be a linear progression, each number represents twice as much light as the previous number as the numbers increase. This provides an easy scale to understand the value of the amount of light falling on a subject.

The light meter uses these values to calculate the combination of camera shutter speed and lens aperture. A knowledge of Exposure Value (EV) will enhance your photography and give you more control over the exposure.

The Exposure Value number must be converted into an f-stop and shutter speed combination so that proper exposure is given to the film or to the sensitivity of the sensor for the ISO which has been chosen, this calculation is done by your camera.

The relationship between Exposure Value, ISO Speed, Shutter Speed and f-stop is given by the following table for an ISO100 film or sensor.

Shutter Speed (seconds) Required for f-stop

EV
f/1.4
f/2
f/2.8
f/4
f/5.6
f/8
f/11
f/16
f/22
f/32
23
-
-
-
-
-
-
-
-
1/16000
1/8000
22
-
-
-
-
-
-
-
1/16000
1/8000
1/4000
21
-
-
-
-
-
-
1/16000
1/8000
1/4000
1/2000
20
-
-
-
-
-
1/16000
1/8000
1/4000
1/2000
1/1000
19
-
-
-
-
1/16000
1/8000
1/4000
1/2000
1/1000
1/500
18
-
-
-
1/16000
1/8000
1/4000
1/2000
1/1000
1/500
1/250
17
-
-
1/16000
1/8000
1/4000
1/2000
1/1000
1/500
1/250
1/125
16
-
1/16000
1/8000
1/4000
1/2000
1/1000
1/500
1/250
1/125
1/60
15
1/16000
1/8000
1/4000
1/2000
1/1000
1/500
1/250
1/125
1/60
1/30
14
1/8000
1/4000
1/2000
1/1000
1/500
1/250
1/125
1/60
1/30
1/15
13
1/4000
1/2000
1/1000
1/500
1/250
1/125
1/60
1/30
1/16
1/8
12
1/2000
1/1000
1/500
1/250
1/125
1/60
1/30
1/15
1/8
1/4
11
1/1000
1/500
1/250
1/125
1/60
1/30
1/15
1/8
1/4
1/2
10
1/500
1/250
1/125
1/60
1/30
1/15
1/8
1/4
1/2
1
9
1/250
1/125
1/60
1/30
1/15
1/8
1/4
1/2
1
2
8
1/125
1/60
1/30
1/15
1/8
1/4
2
1
2
4
7
1/60
1/30
1/15
1/8
1/4
1/2
4
2
4
8
6
1/30
1/15
1/8
1/4
1/2
1
2
4
8
15
5
1/15
1/8
1/4
1/2
1
2
4
8
15
30
4
1/8
1/4
1/2
1
2
4
8
15
30
60
3
1/4
1/2
1
2
4
8
15
30
60
120
2
1/2
1
2
4
8
15
30
60
120
240
1
1
2
4
8
15
30
60
120
240
480
0
2
4
8
15
30
60
120
240
480
-
-1
4
8
15
30
60
120
240
480
-
-
-2
8
15
30
60
120
240
480
-
-
-
-3
15
30
60
120
240
480
-
-
-
-
-4
30
60
120
240
480
-
-
-
-
-
-5
60
120
240

480

-
-
-
-
-
-

Practical Considerations

It should be noted that all cameras or lightmeters may not cover the full range of Exposure Values, f-stops, ISO speed or shutter speeds referenced in the above table.

With film cameras, once the camera is loaded with film there are essentially two variables, the shutter speed and the lens aperture, however with digital cameras there are three variables to be considered for each exposure, the shutter speed, the lens aperture and the camera ISO setting which gives far more flexibility for the digital camera.

White Balance and Color Temperature

The reason we need to adjust the colors reorded by the camera is because the scene we are photographing may be lit by different light sources and the variation in light sources may cause a color cast in the final image, the color cast which a light source may exhibit is determined by the color temperature of the light source. The unit of measurement for color temperature is Kelvin (K).

Various light sources are approximately categorised with color temperatures as follows:

  • 1700-1900K, Match flame or candle light
  • 3000K, Warm fluorescent light
  • 3000-3300K, Incandescent light bulb
  • 3200K, Sunrise or sunset
  • 3400K, Photo flood light
  • 4000K, Moon light
  • 5500K, Sunny daylight around mid day
  • 5500K, Electronic photo flash
  • 6000K, Overcast sky
  • 7000-8000K, Summer shade

The above diagram shows the effect of color temperature changes with differing colored light sources.

As the color temperature changes from daylight to the low end (candle light) the color cast will gradually move to a red cast and as the color temperature moves from daylight to the higher end the color cast will gradually move to a blue color cast.

The camera control for white balance to correct the color cast will need to be adjusted to match the color temperature of the light source illuminating the scene. Generally most cameras will control white balance automatically and some cameras will do this better than others. Many cameras will also have a manual control for white balance so that the user can select the actual color source illuminating the scene.

Generally a slight blue cast in a picture will give a cooler feeling to a picture and a slight red cast can give a warmer feeling to a picture. Some photographers may wish to give the image a slight cast in such a way that it enhances the image. The following images show the effect of three different camera settings of white balance and the resulting images. These images are taken in daylight with different in camera white balance settings.

Image taken with the camera white balance setting at daylight

Color temperature set at 3000K Color temperature set at 8000K

ISO Speed

ISO speed is a number that indicates the sensitivity of the film or the imaging sensor to to the light. ISO sensitivity is measured by a set of standards established by the International Standards Organization (ISO). In general, films with a higher sensitivity (larger ISO number) have coarser grain and do not register detail as well as films with lower sensitivity (lower ISO number). With digital sensors, in general the larger ISO number will cause more noise in the sensor and will degrade the resulting picture to some extent, however there are some software application packages which can filter out the noise from the digital file.

The number series for ISO film speed is:

25, 50, 100, 200, 400, 800, 1600, 3200, 6400,12800

Moving to the right in the above table, each number is twice the preceding number, and represents twice the sensitivity to light as the previous number. There can be some intermediate steps (such as 64 or 125) on the camera dial which represent fractions of the above number series.

Lower ISO is more suited when you require higher image quality with less grain or noise in the image. Higher ISO is more suited when you require higher speed to capture moving subjects or when shooting in dull light.