
The histogram on your camera is the most important camera control or tool to ensure that you capture a full range of tones in the image. When you look at the histogram it essentially represents the number of stops of exposure which the camera is capturing.
The far left side of the histogram represents full black and the far right side indicates full white. The difference from left to right indicates the dynamic range of the camera, depending on the camera the difference may be 5 EV (5 stops) or 6, 7 or 8 EV depending on the capability of the camera in capturing the full range of tones. The correct exposure is when all of the histogram graph is contained within the far left and far right limits of the histogram.
The histogram at the left indicates that the full range of tones has been captured with the majority of the tones in the middle. It does not matter how high it is as long as it is not touching the left side or the right side and also that none of the tones have extended beyond those limits and have been cut off.
If the graph is touching the left side it shows that areas in the image are conpletely black and and you will not be able to fix these areas of the image in post processing, thus some of the dark tone detail will be lost.

If the graph is touching the right side of the histogram it shows that areas in the image are conpletely white, blown out and and you will not be able to fix these areas of the image in post processing, thus some of the blown out detail will be lost.
If pixels are completely black or completely wthite the piuxels can be lightened or darkened, but the detail represented can never be recovered.
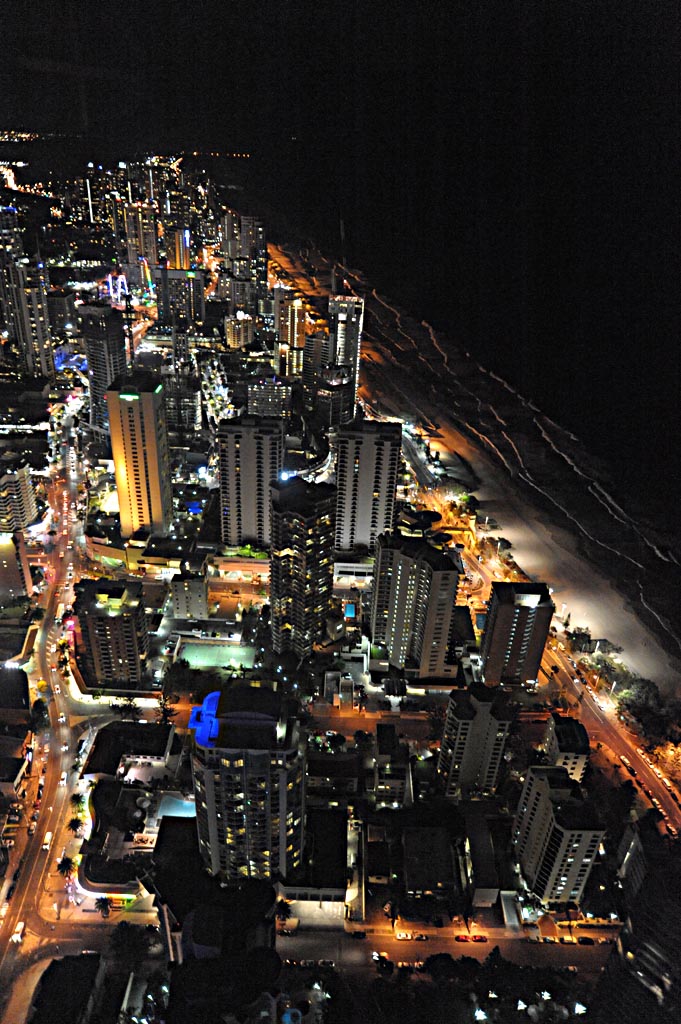
The histogram on the left is the histogram representing a dark night scene where most of the content of the histogram is close to the lleft side representing black, but note the none of the black detail has been lost or cut off on the left side. To see the actual image of this histogram click here.
In the Dark tone histogram above it can be seen that most of the tonal values are on the left side of the histogram, however this is to be expected as the image was a dark night scene with only a small amount of city lights in the background. In this image some of the tones on the left may have been cut off and consequently there may be a small amount of blown highlights in the city lights.

In the last histogram it represenst a scene with quite a lot of light tones in the image, however from the histogram we see that there are no tones cut off on the left side and although there nis a lot of tonal content close to the right side there are no tones cut off.
A good exposure needs a large range od tonal values, fully spread acrass the histogram with none of the tones touching either side of the histogram.
The general theory behind a perfect digital file is to expose to the right of the histogram, but to ensiure that no tones are cut off at the right side. Even if your end result is a dark looking image it may be better to expose to the right and then darken the image later in post processing.